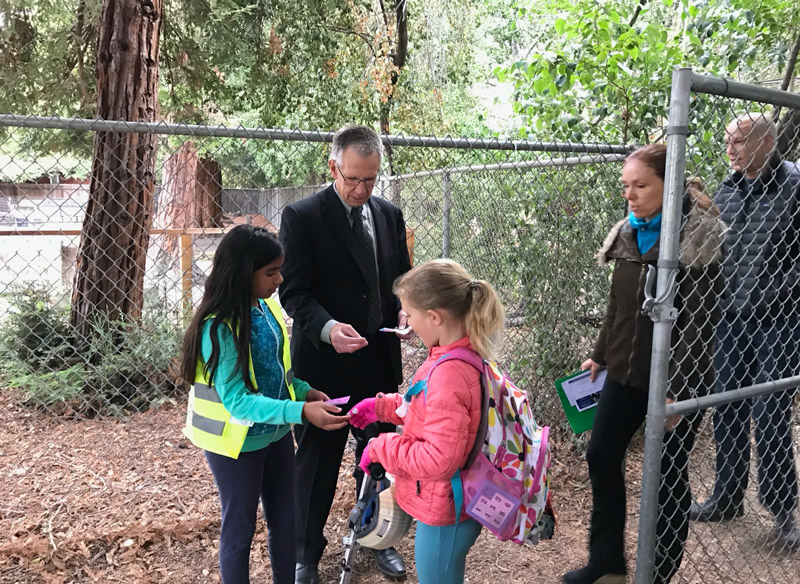
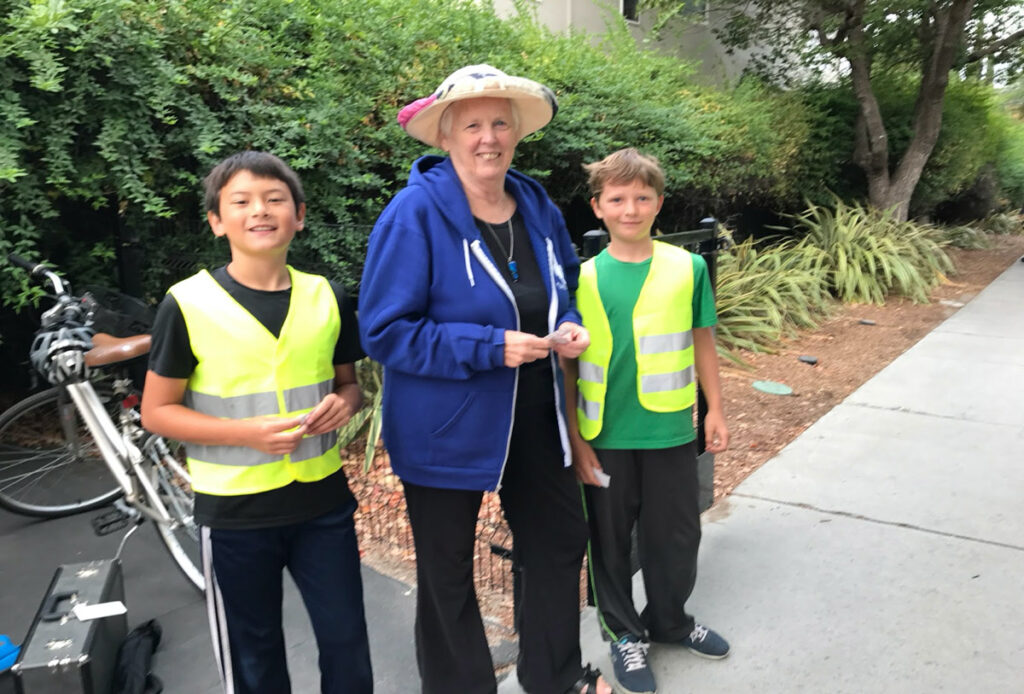
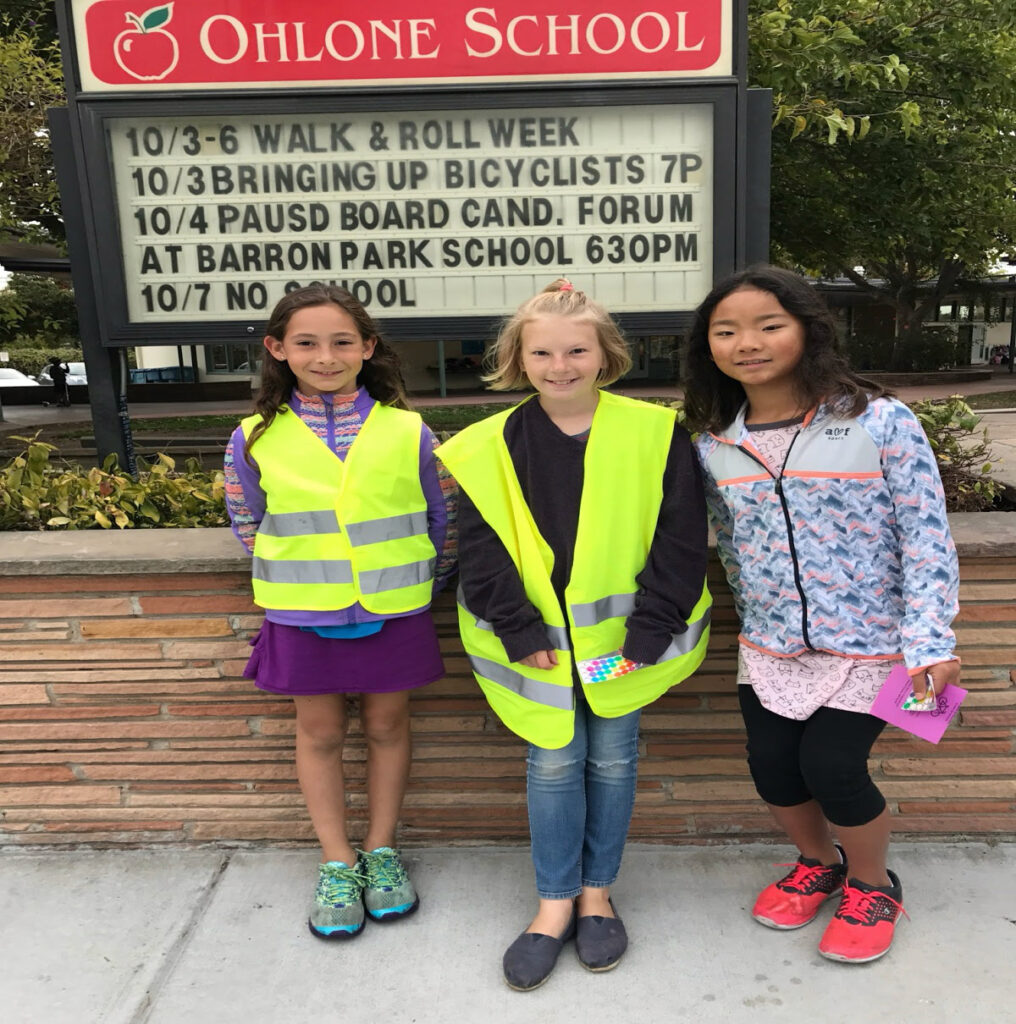
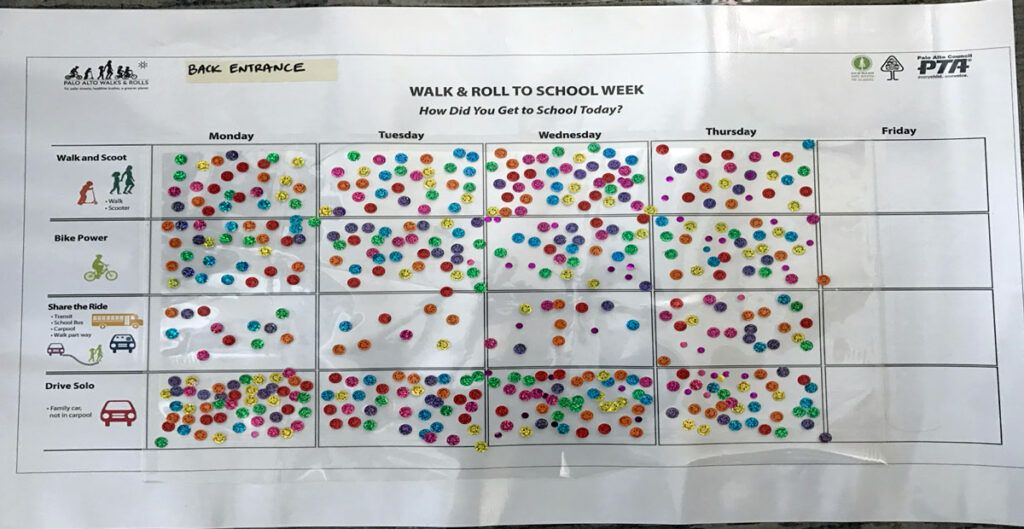
Each year, the PTA Council, PAUSD, and the City of Palo Alto sponsor the Walk and Roll Count to encourage school children to use safe and energy efficient ways to come to school. Ohlone is a commuter school for many students since it draws from throughout the district. Ohlone Guides (a student service organization), parents, and administrators were at the three entrances to the school to hand out stickers. Students and their families were asked to put the stickers on a chart showing how they came to school on each of four days in October. This provided a great opportunity to use math in a real world context.
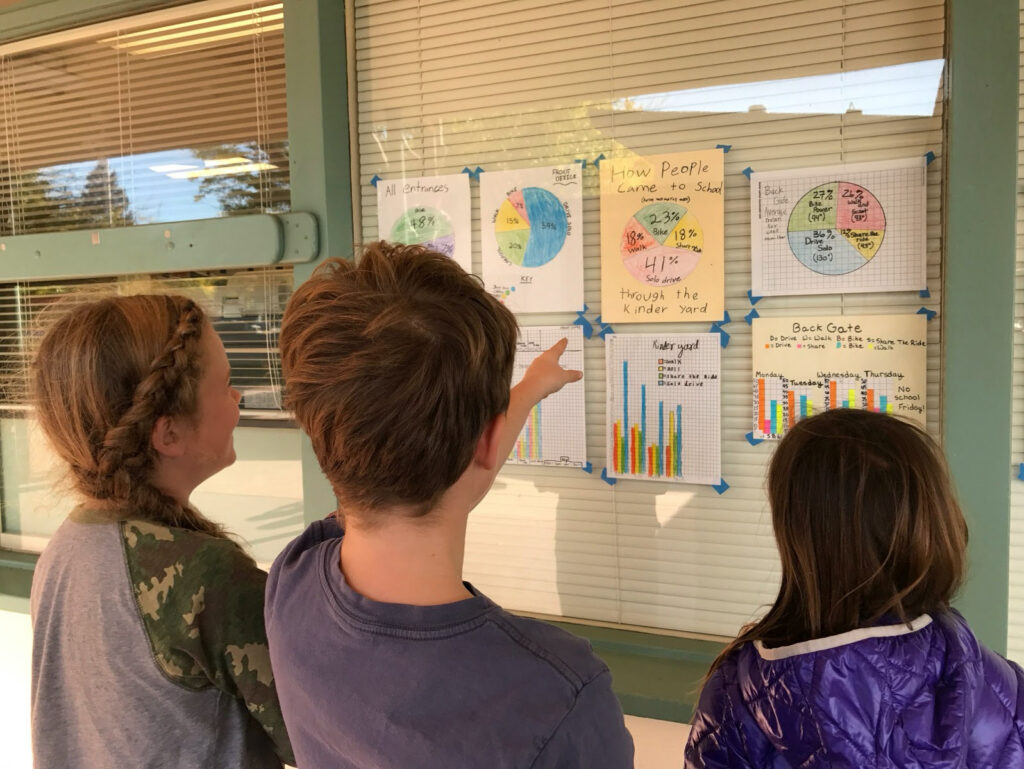
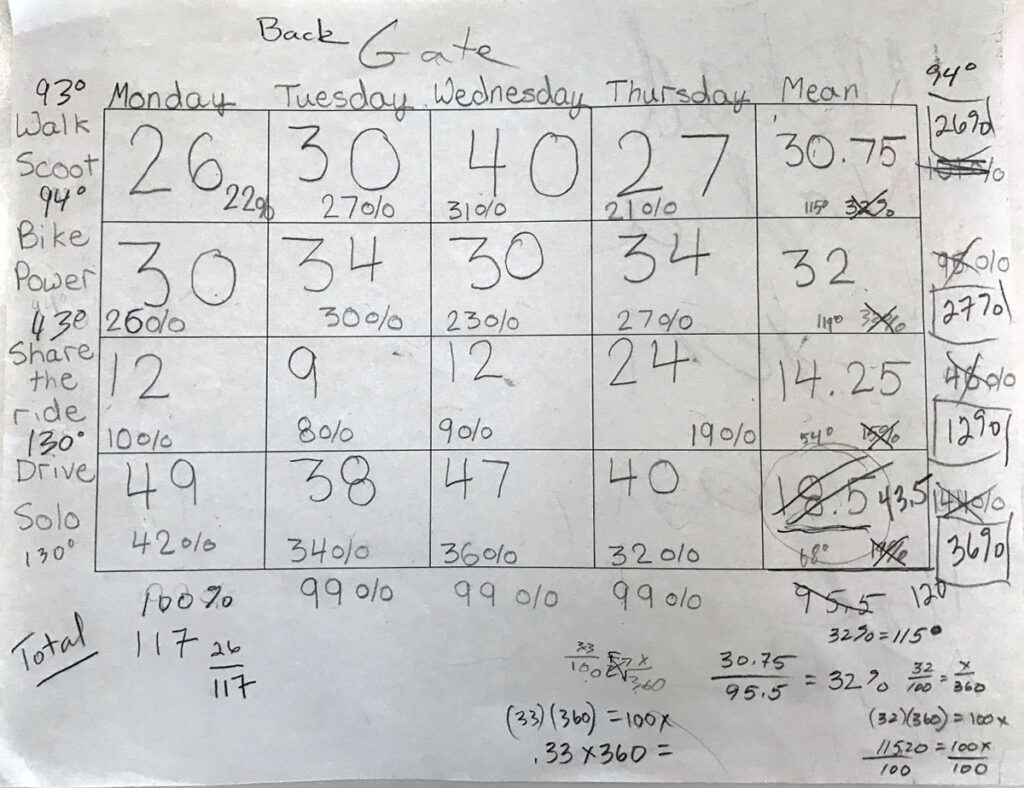
One 4th-5th class took the charts and converted the dots into numbers. Working in small groups for each of the three entrances, students calculated the mean average for the week and converted those values into percentages.
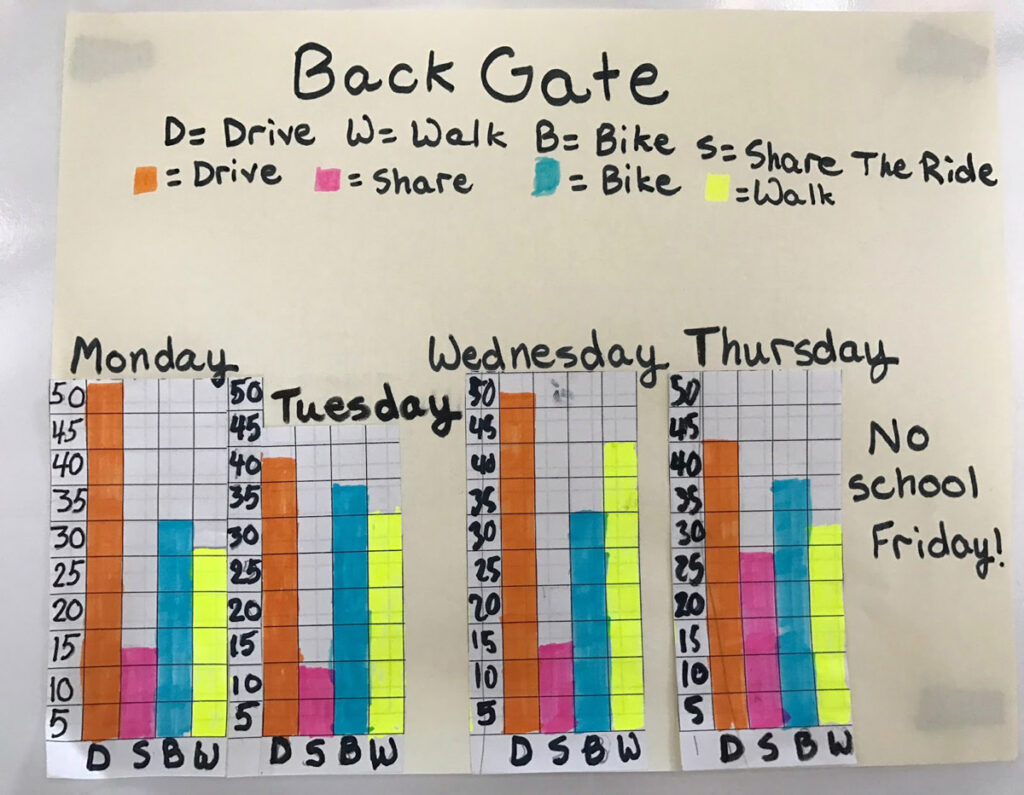
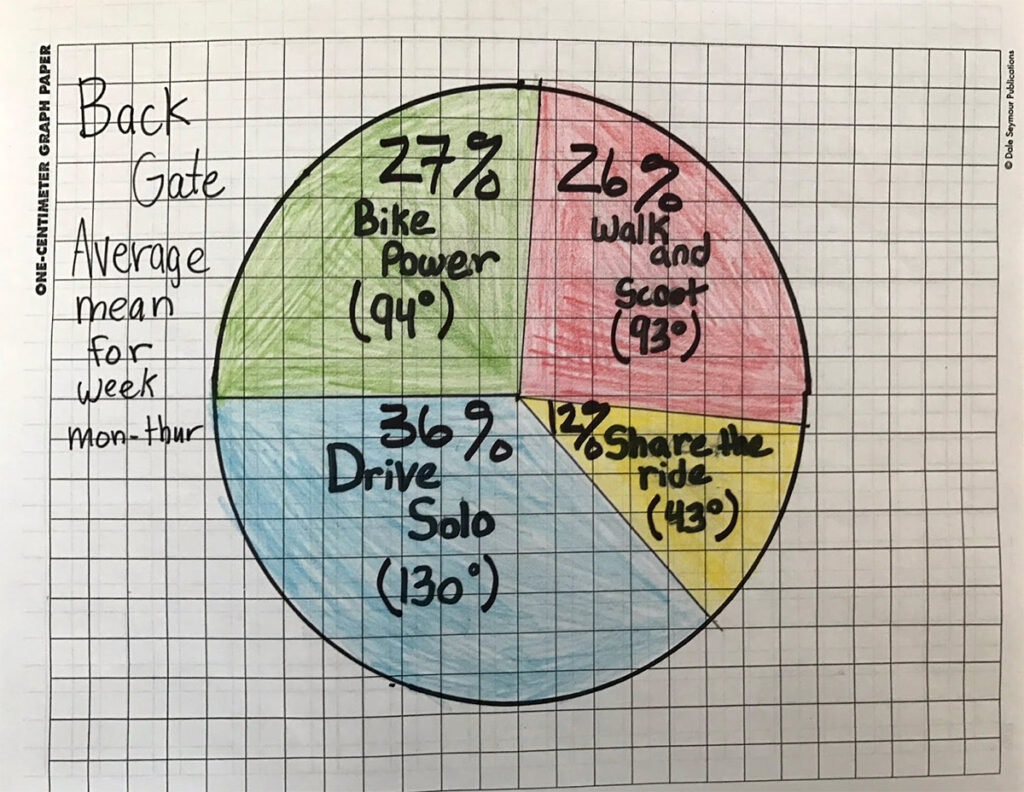
They constructed bar graphs to show the relative numbers for each day and circle graphs to show the aggregate percentages for the week.
Math involved included accurately counting the dots to convert the raw data to numbers. Then the numbers were used to calculate the mean for each category. Those values were compared to the total number at each entrance to determine percentages. The percentages were used to find the corresponding angle so that the circle could be divided into a graph comparing the weekly averages.
The students were enthusiastic in their work, learning specific tools, such as calculating the mean, percentages, and measuring angles, as they needed them to complete their graphs. The driving question was how to display the collected data so that it could be better used to ask questions and make inferences.
Working with a parent volunteer, the students came up with the observations and questions.
Here are some samples:
- Biking was the most popular way to come to the Back Gate.
- Not many bikers use the Front Entrance.
- Lots of bikers use the Kinder Gate.
- 59% of people arriving at the Front Entrance drive solo, 20% carpool.
Why do so many people drive to Ohlone? We wondered if the fact that we draw from the entire district made a difference and how our data might compare to a neighborhood school.
Data was posted in the office window for the community to see.